MARKET RISK ENGINE
A full-revaluation VaR engine built in five scopes: raw instrument-level market data → calibrated risk factors → Monte Carlo scenarios → full revaluation → portfolio VaR/ES → sub-risk decomposition → sensitivity/stress testing → nested path simulation. Anchored to a real single-day snapshot of live IG market prices across equity indices, commodities, and rate/bond futures, with every simulated risk factor's provenance documented end to end.
Go to Repo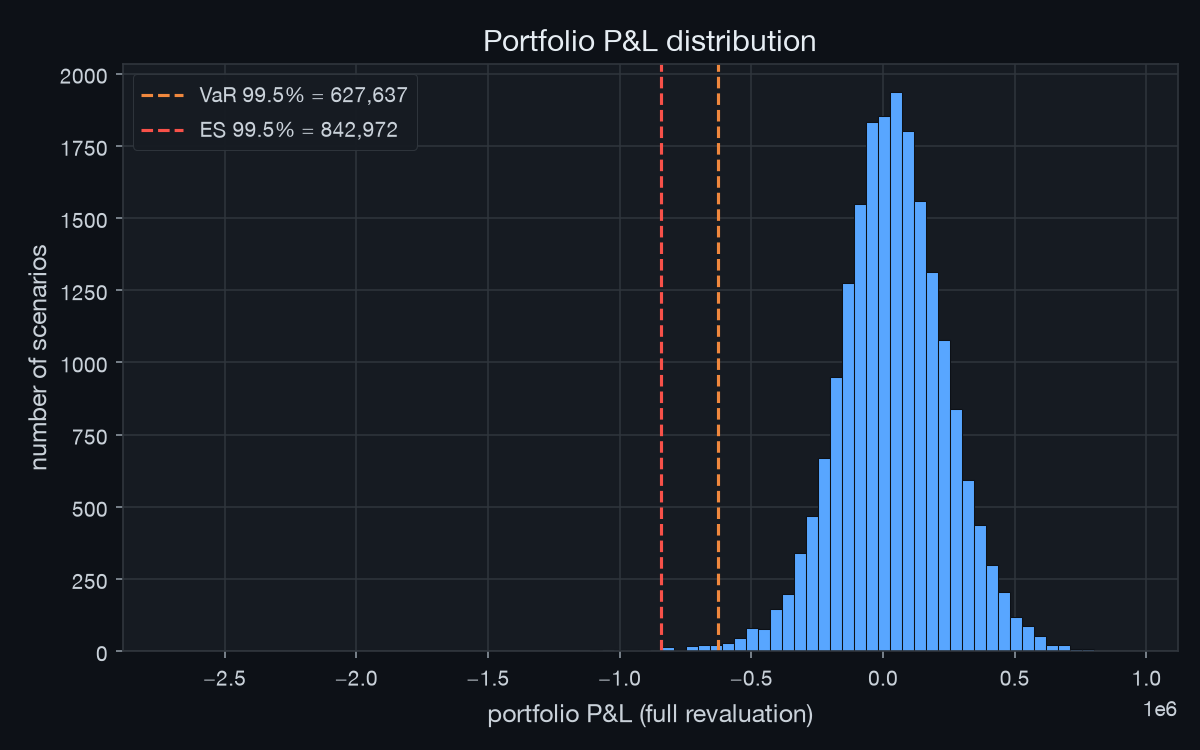
THE IDEA
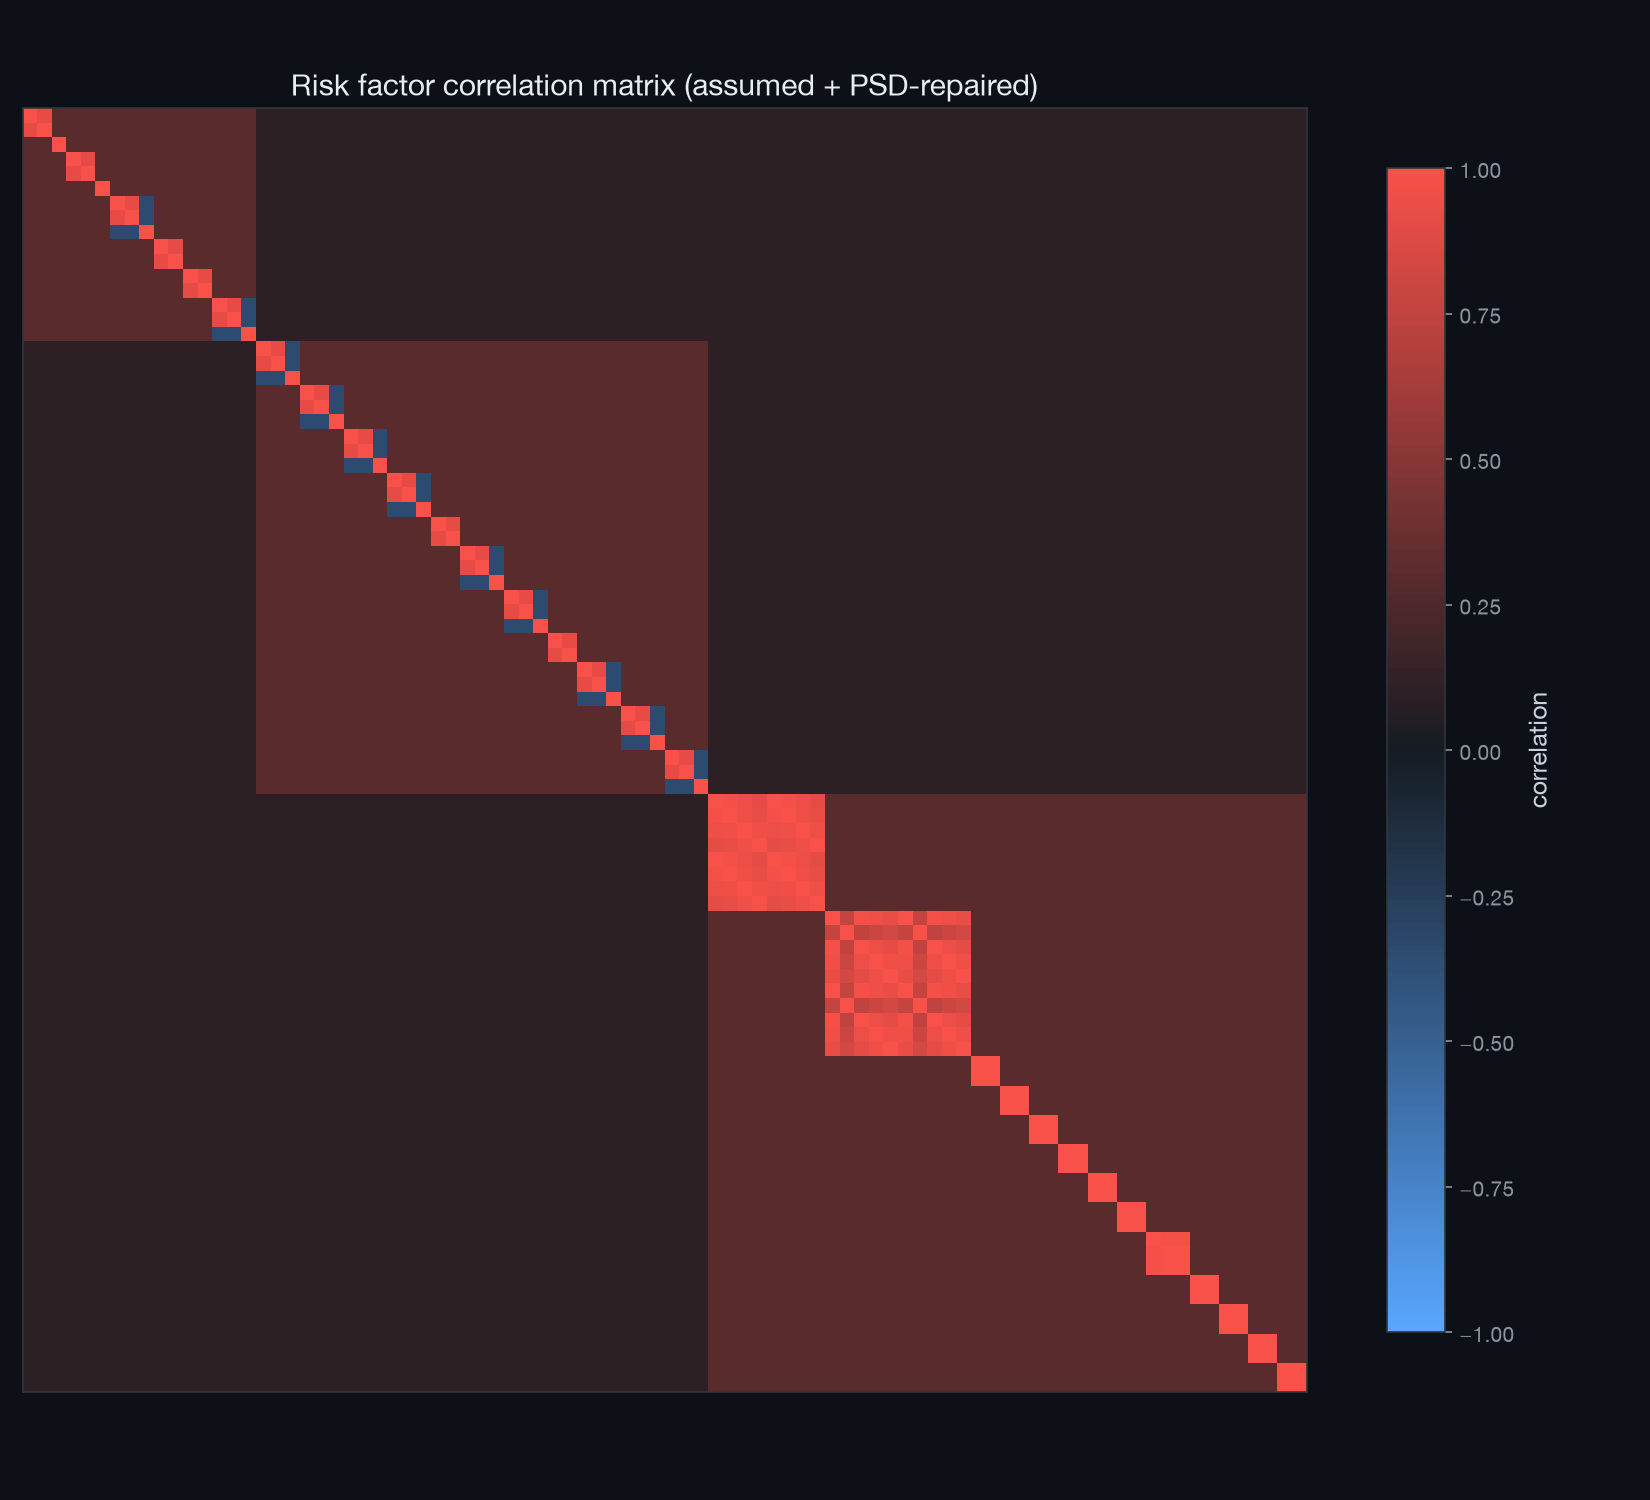
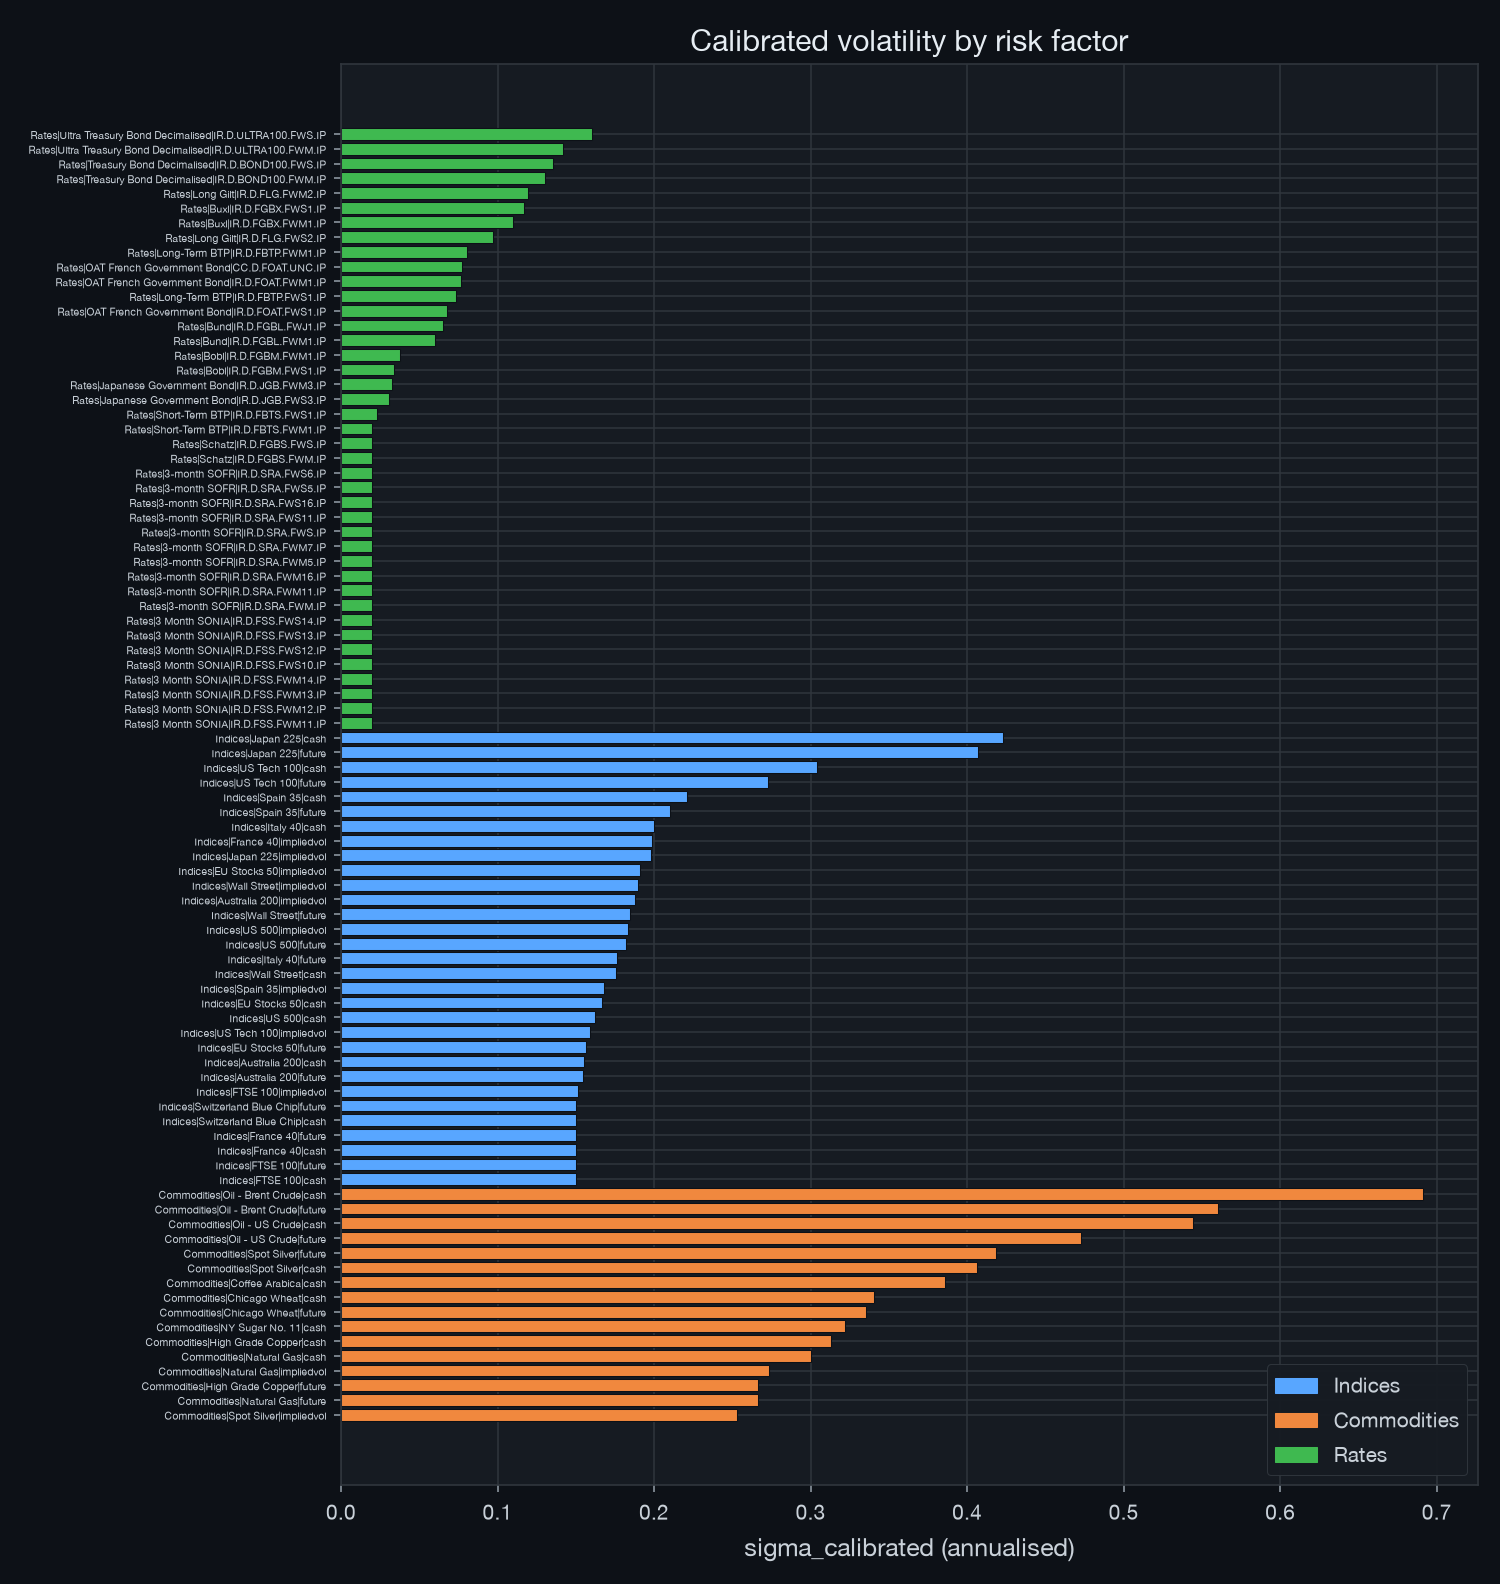
Most VaR demos either fabricate a portfolio from thin air or hide the difference between a delta approximation and a real reprice. This build starts from one real thing (a single day's live IG market snapshot across equity indices, commodities, and rate/bond futures) and is explicit about every step downstream that is necessarily simulated, because that snapshot alone is too thin to calibrate 88 risk factors. Every risk factor takes a documented “simulate one full history once, seeded from the real snapshot, persist and never regenerate” path, with the provenance decision recorded per scope.
The engine is a five-scope pipeline, each one a separate package whose output feeds the next: calibration & scenario generation, full revaluation & portfolio VaR, sub-risk decomposition, sensitivity & stress testing, and nested path simulation.
THE FIVE SCOPES
| Scope | Method | Output |
|---|---|---|
| 1. Calibration | Lognormal / shifted-Black-Karasinski / Student-t marginals, PSD-repaired correlation matrix, Sobol Gaussian copula | 88 calibrated risk factors, 20,000-scenario shock matrix |
| 2. Full Revaluation | Black-76 (options), flat-curve DCF (bonds), direct shock (cash/futures) | Portfolio VaR/ES, delta-only comparison |
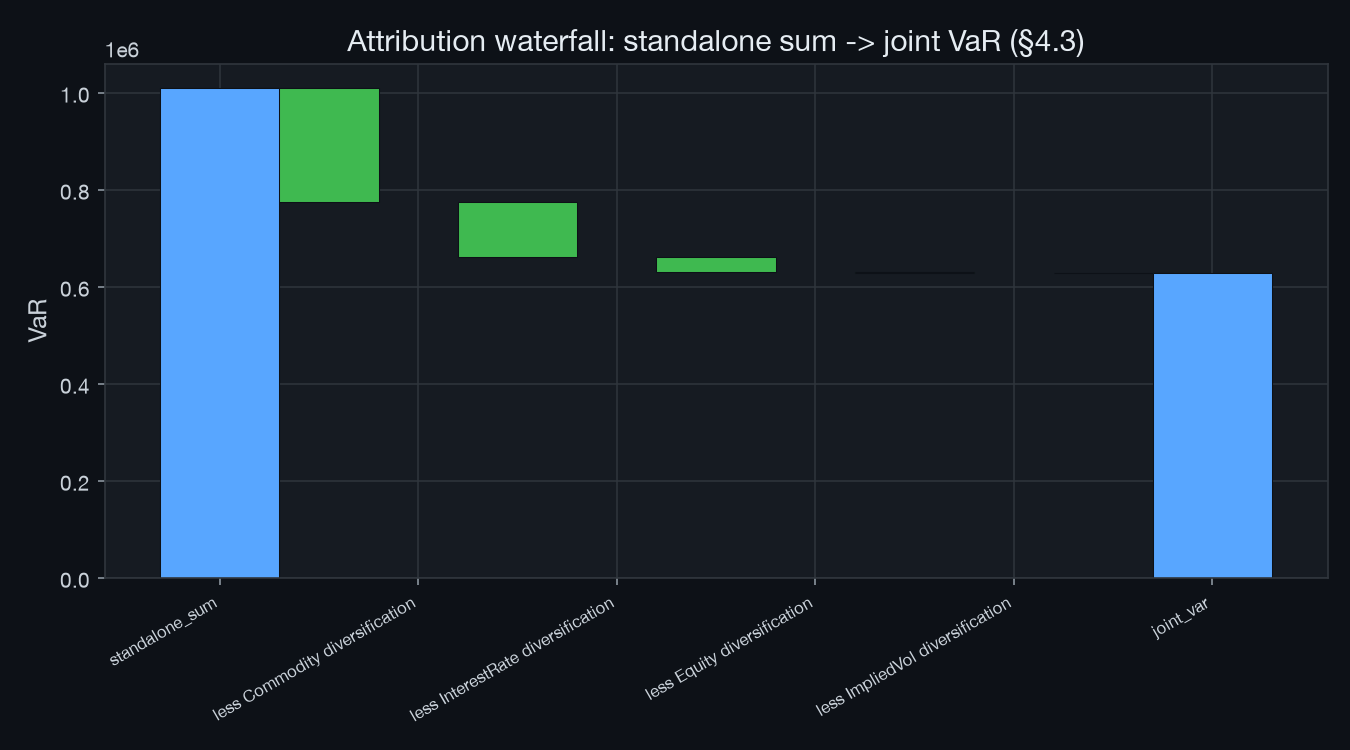
| 3. Decomposition | Sub-risk split (Equity, Commodity, IR, Implied Vol), leave-one-out attribution | Diversification benefit, marginal contribution per position |
| 4. Sensitivity & Stress | Parallel/twist/butterfly/KRD curve shocks, historical replay, reverse-stress search | Stress P&L, sensitivity harness on calibration choices |
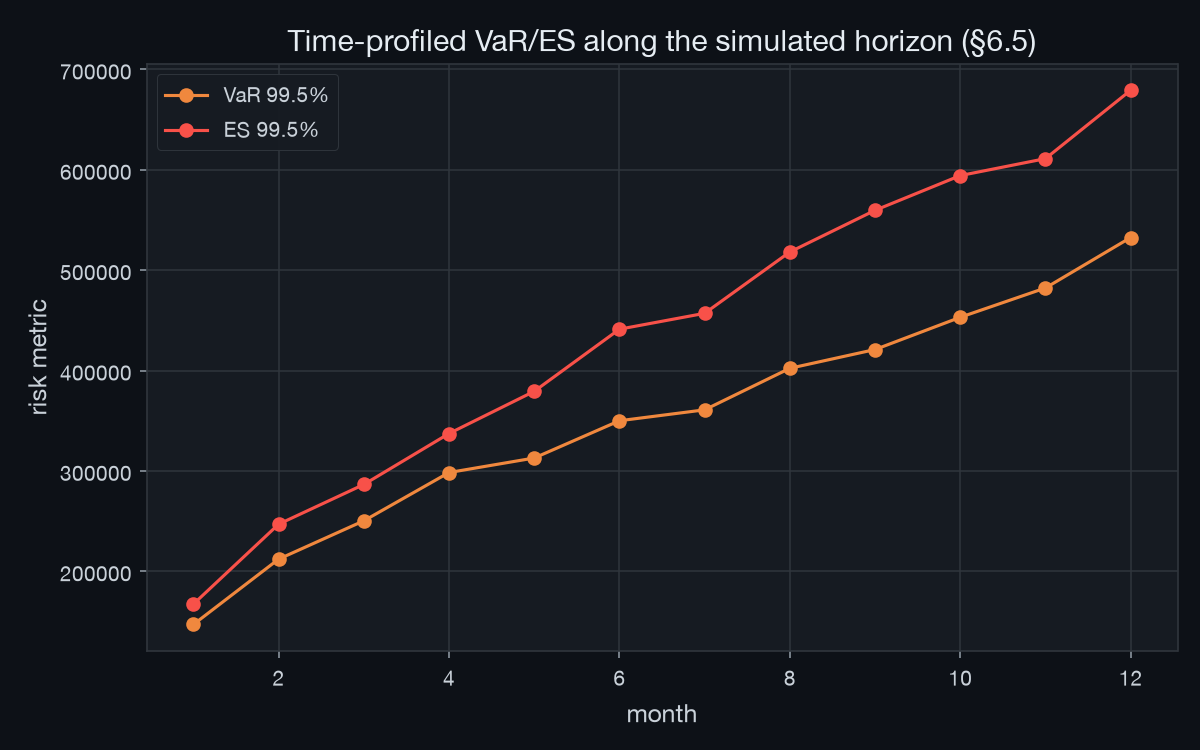
| 5. Nested Simulation | Correlated multi-step outer paths (GBM/OU/fat-tailed) with closed-form inner reprice | Time-profiled VaR/ES, drawdown, PFE-style exposure |
FULL REVALUATION VS. DELTA-ONLY
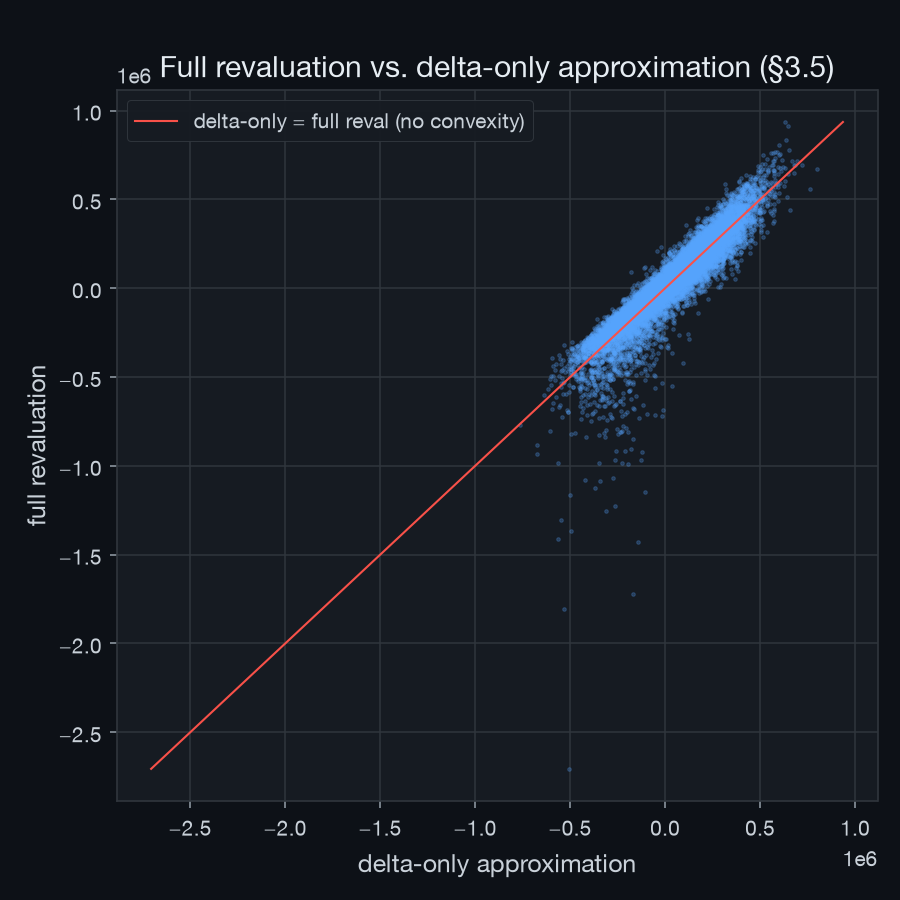
Every position in the 11-line sample book (4 direct, 2 bonds, 5 options) is repriced from scratch under all 20,000 scenarios, not approximated by its greeks. The gap against a delta-only estimate is a direct, visible measure of the book's convexity: at the 99.5% level, full revaluation reports a VaR of 627,637 against 466,925 delta-only. Convexity alone accounts for a roughly 34% understatement.
DIVERSIFICATION IS NOT A CONSTANT
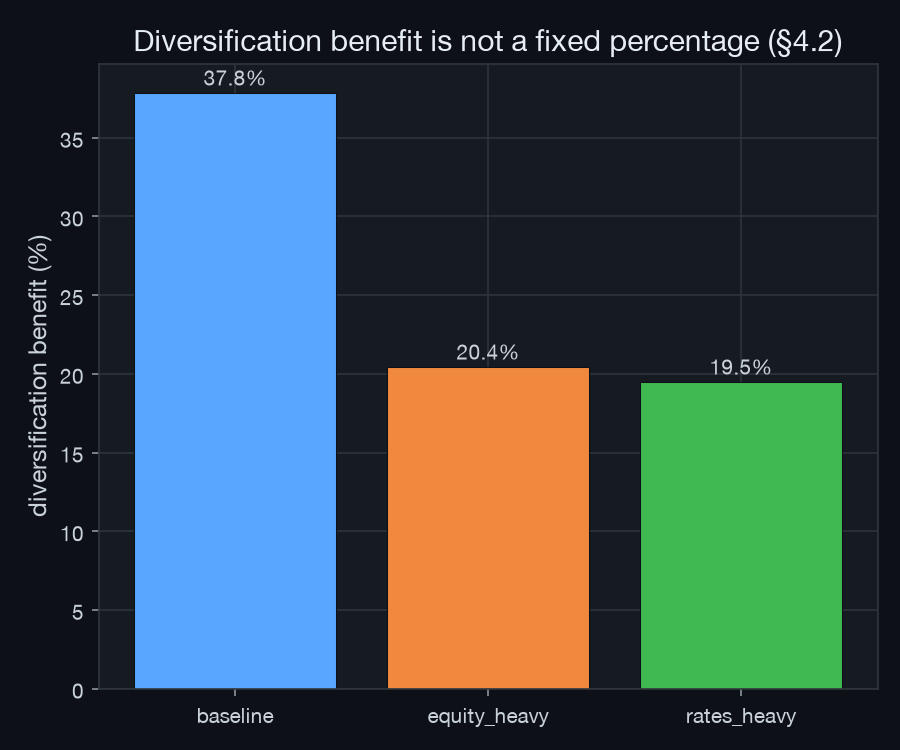
Splitting the joint scenario set into four sub-risks and rerunning the whole decomposition on two differently-weighted portfolios shows the diversification benefit swings from 37.8% on the baseline book to roughly 20% and 19.5% on equity-heavy and rates-heavy variants, proof that a single diversification percentage doesn't generalize across books.
WHAT BREAKS THE MODEL
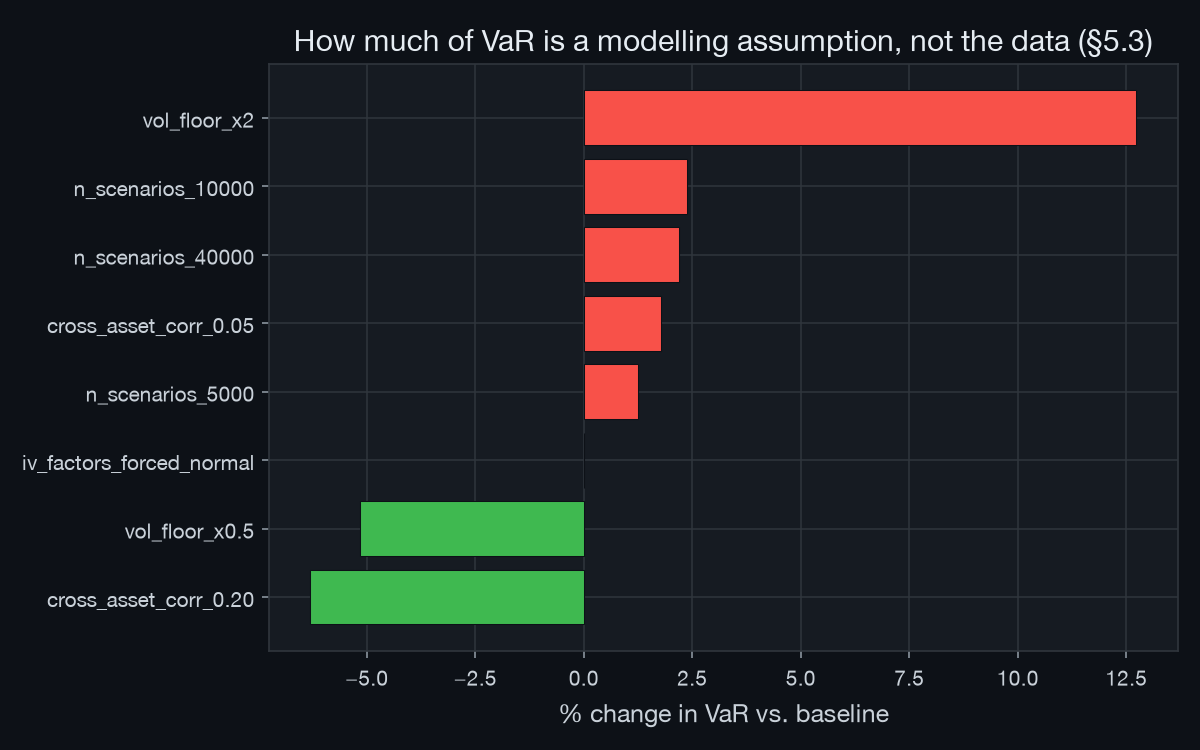
The sensitivity harness reruns Scope 1's calibration in-memory under different modelling choices. The single most fragile assumption found is the volatility floor: doubling it alone moves VaR by +12.7%, more than doubling the scenario count does. Scope 5's antithetic-variance experiment is reported exactly as measured, including where the textbook result fails (antithetic paths roughly halve the variance of the mean P&L as theory predicts, but *increase* variance for the VaR/ES tail estimators).
SELECTED CHARTS