INSURANCE SIMULATION SUITE
A PyQt6 + pyqtgraph desktop app running six classes of actuarial Monte Carlo simulations side-by-side. Every tab streams results live as samples accumulate, with interactive zoom, pan, and hover on all plots — covering reserving, pricing, Bayesian credibility, multi-state life, copula capital, and extreme value theory.
Go to Repo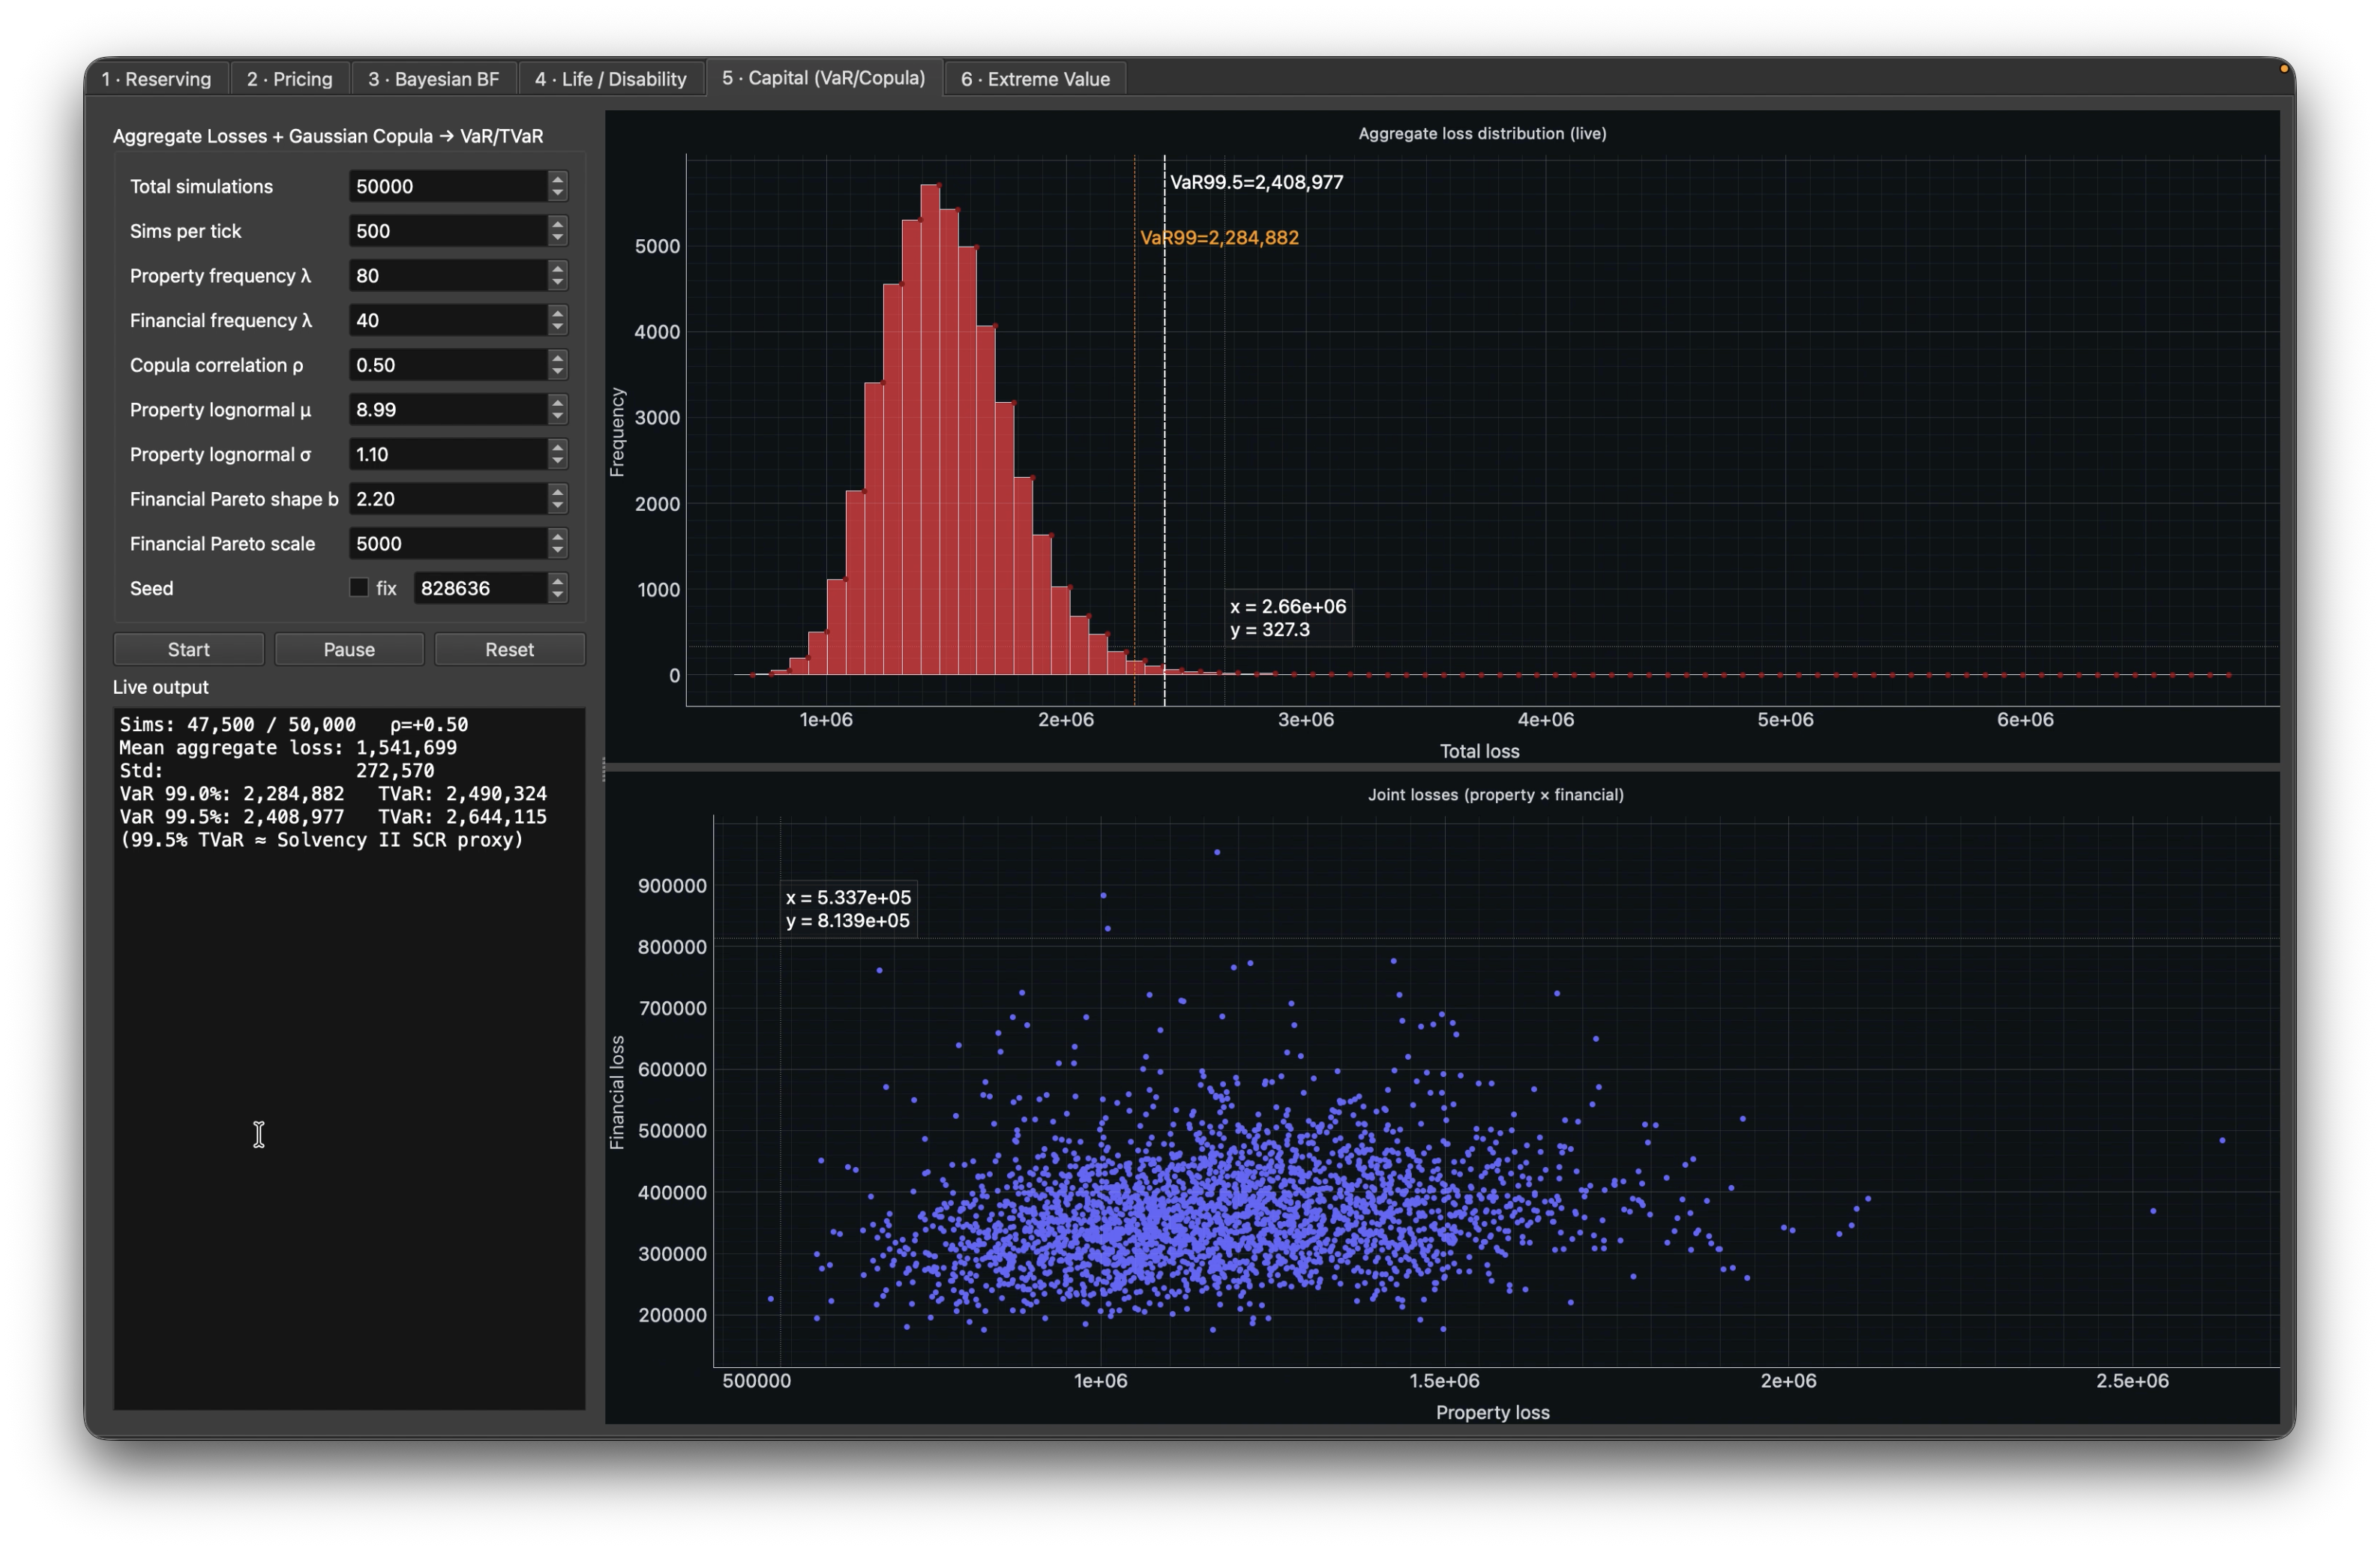
THE IDEA
Actuarial models are usually run as one-shot batch jobs — you push a button, wait, and read a number. This suite flips that into a live, streaming experience: each of six canonical models runs in its own tab with independent Start / Pause / Reset controls, and every plot updates tick-by-tick as Monte Carlo samples accumulate.
The seed is exposed in every tab with a fix checkbox — unticked, a fresh random seed is drawn on each Reset and written back into the spinbox so any run can be pinned and reproduced.
THE SIX MODELS
| Tab | Method | Output |
|---|---|---|
| Reserving | Mack Chain-Ladder + ODP Bootstrap | IBNR distribution, VaR / TVaR 95% |
| Pricing | GLM Poisson × Gamma | Pure premium, loss-ratio convergence |
| Bayesian BF | Bornhuetter-Ferguson + credibility | Posterior IBNR, 95% credible interval |
| Life / Disability | Multi-state Markov (Gompertz) | PV of disability annuity benefit |
| Capital | Aggregate losses + Gaussian copula | VaR / TVaR 99% & 99.5% (SCR proxy) |
| Extreme Value | Peaks-Over-Threshold (GPD) | Tail VaR 99% / 99.5% / 99.9% |
RESERVING — BOOTSTRAP CHAIN-LADDER
A synthetic loss-development triangle is built and volume-weighted chain-ladder factors are fit to project the lower triangle and compute IBNR per accident year. The ODP bootstrap then resamples Pearson residuals on the back-cast incrementals and re-fits the chain-ladder on each pseudo-triangle, producing a full predictive distribution of total reserves. VaR 95% and TVaR 95% are read off the empirical bootstrap distribution.
CAPITAL — COPULA AGGREGATION
Two correlated lines (property & financial) are simulated with a Gaussian copula on their Poisson frequencies, with lognormal and Pareto severities respectively. The aggregate loss distribution is reported with VaR / TVaR at 99% and 99.5% — the latter serving as a Solvency II SCR proxy. The joint scatter shows how line co-movement tightens or loosens with correlation ρ.
EXTREME VALUE THEORY
A heavy-tail sample (lognormal body + Pareto contamination) is generated, then a Generalised Pareto Distribution is fit to exceedances over a high-quantile threshold. Tail quantiles are extrapolated using the POT formula and reported at 99%, 99.5%, 99.9%. A positive shape parameter ξ signals heavy tails — typical of catastrophe and large property losses.
WHY LIVE STREAMING
- Convergence is visible: watching loss ratios or quantile estimates settle in real time builds intuition that batch reports hide.
- Reproducibility on demand: the seed-pin workflow lets any interesting random run be locked and re-examined.
- Side-by-side comparison: six models, one app — the same Monte Carlo machinery applied across the actuarial pipeline.
- GPU-accelerated plots: pyqtgraph keeps interactivity smooth even when each tick adds thousands of samples.