BTC 5-MIN EXPECTED VALUE
Backtesting a positive-EV strategy on 5-minute binary option contracts across BTC, ETH, SOL, and XRP using real on-chain price data from Chainlink oracles. The strategy exploits the symmetric pricing of binary contracts with an asymmetric risk/reward exit rule.
Go to Repo Read Blog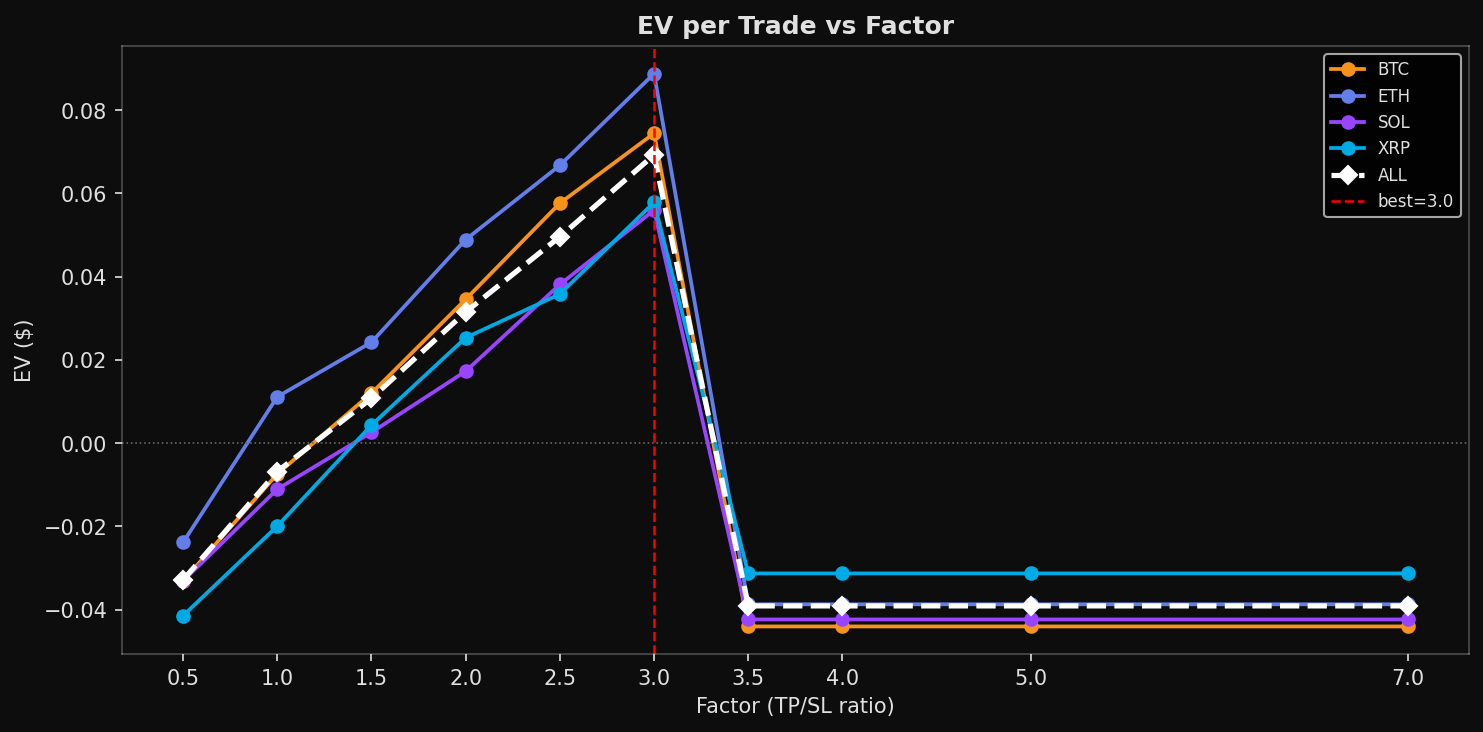
THE IDEA
Binary options resolve to $1 (win) or $0 (lose). At the start of every 5-minute contract, both UP and DOWN are priced near $0.50 — a fair coin flip. The strategy exploits this symmetry by applying an asymmetric risk/reward exit rule: a tight stop-loss and a wide take-profit, so that each win pays multiples of each loss.
| Parameter | Value |
|---|---|
| Entry | $0.50 |
| Stop Loss | $0.35 (risk = $0.15) |
| Take Profit | Variable (factor sweep) |
| Side | Random (UP or DOWN, seeded per contract) |
The strategy doesn't need to win often — it just needs the asymmetry to compensate for the lower hit rate. For a 3:1 factor (TP = $0.95), the theoretical EV per trade is +$0.15.
DATA & METHODOLOGY
Each contract is stored as a JSONL file with three record types: a header containing contract metadata (asset, condition ID, start/expiry times, strike price), tick-level state snapshots (bid/ask for UP and DOWN, Chainlink price, seconds remaining), and a footer with the resolution outcome.
The dataset comprises ~572 contracts across 4 crypto assets, collected in March 2026. A cleaning step drops all ticks where the Chainlink price is null, removing stale data from contract-open lag.
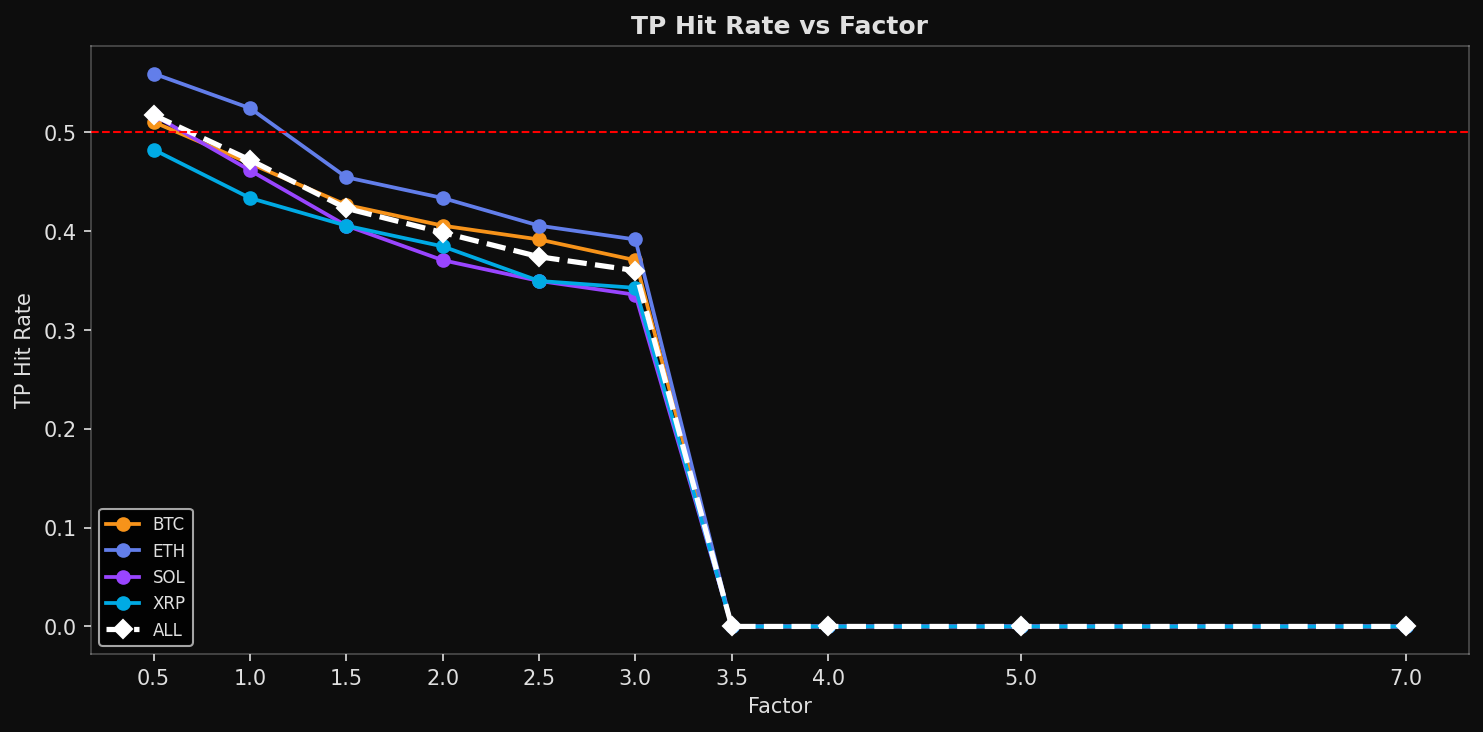
FACTOR SWEEP
The core analysis sweeps the TP:SL ratio (factor) from 0.5 to 7.0 while holding SL fixed at $0.35 and entry at $0.50. Two factor levels are examined in detail:
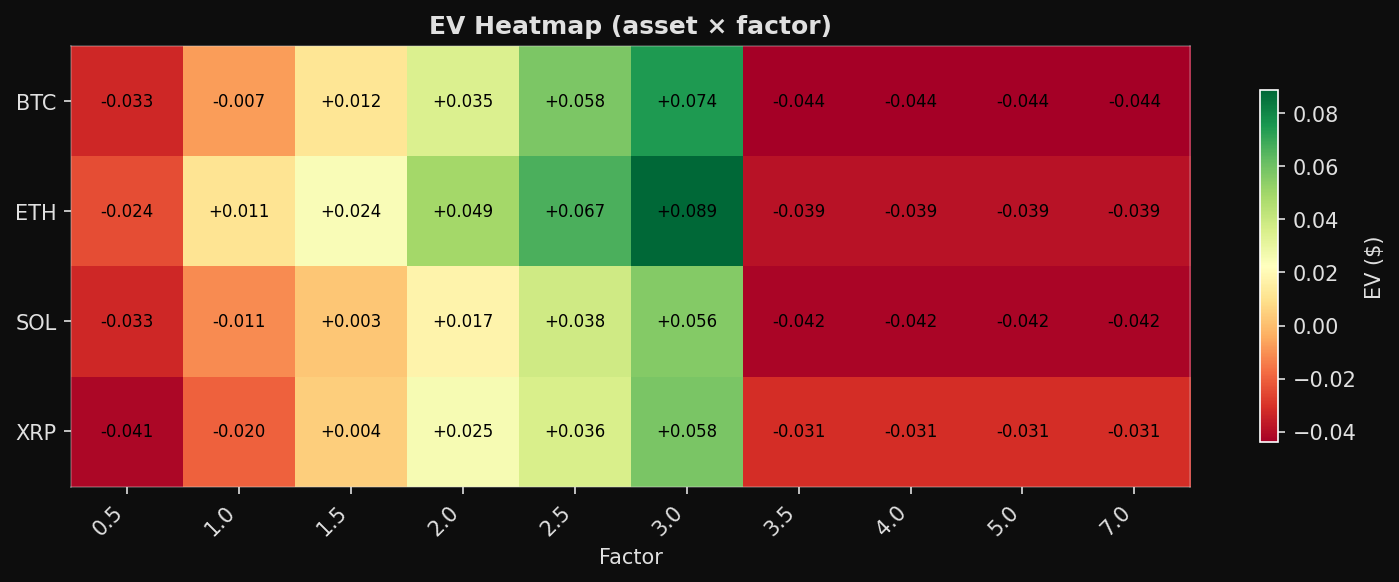
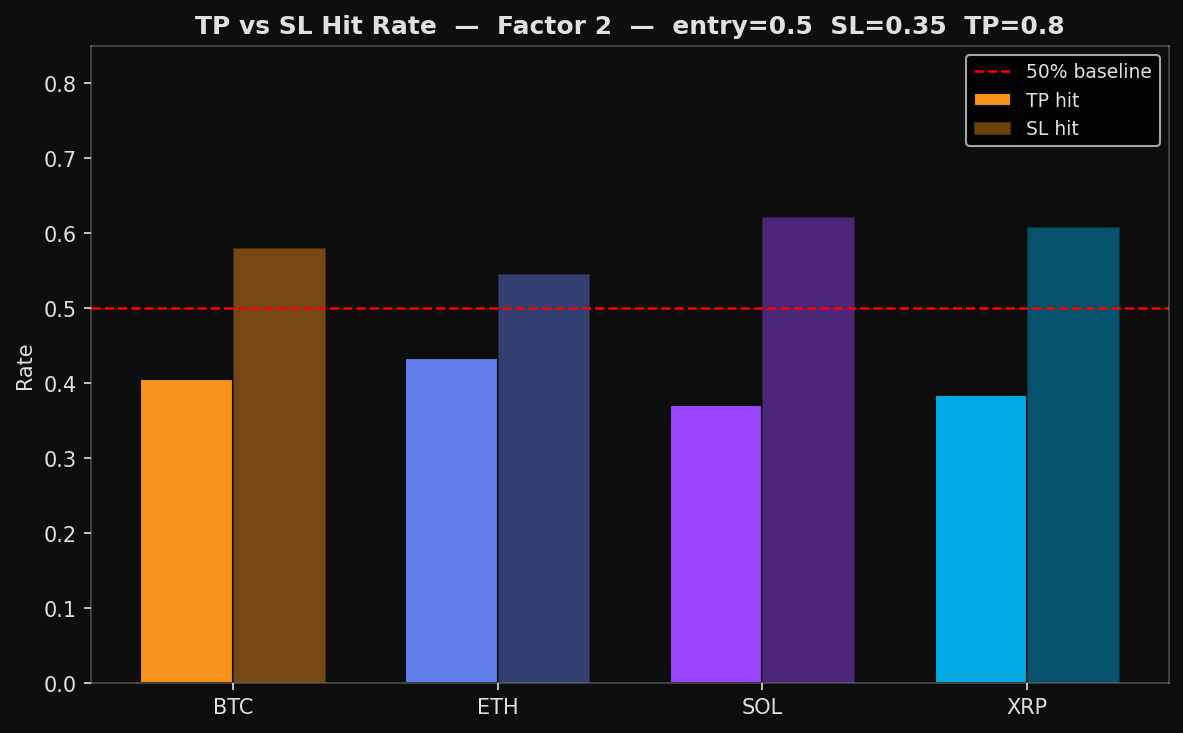
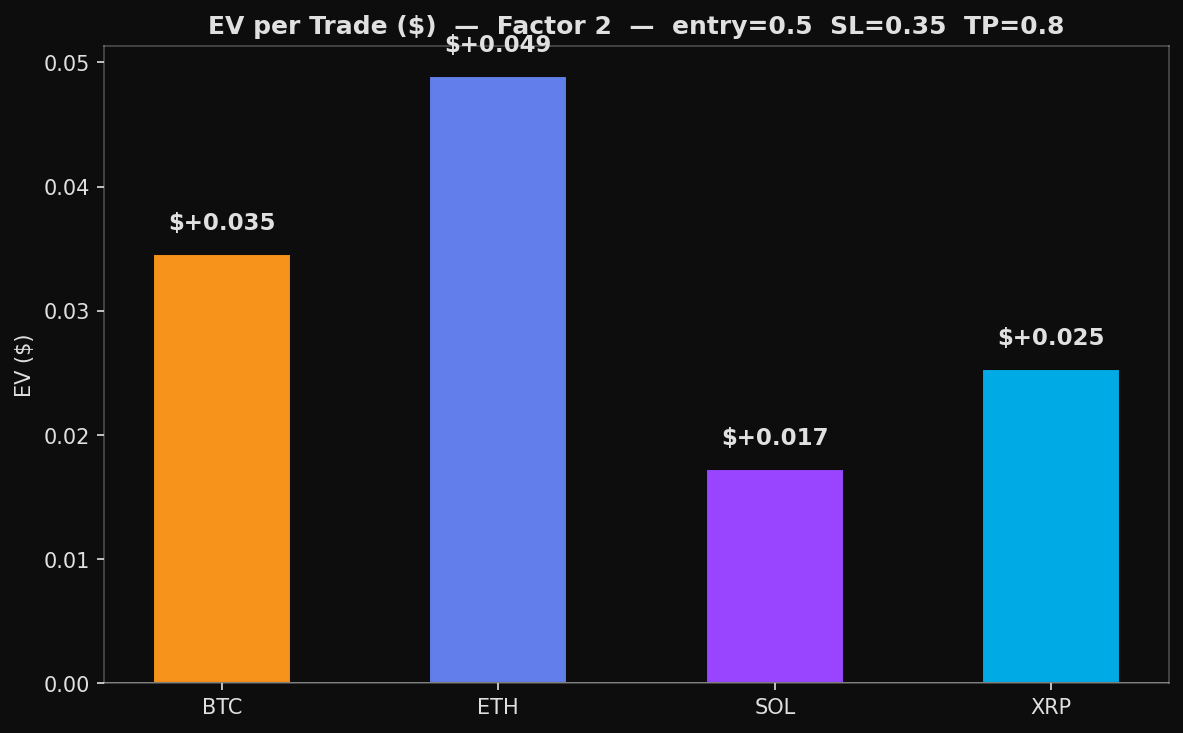
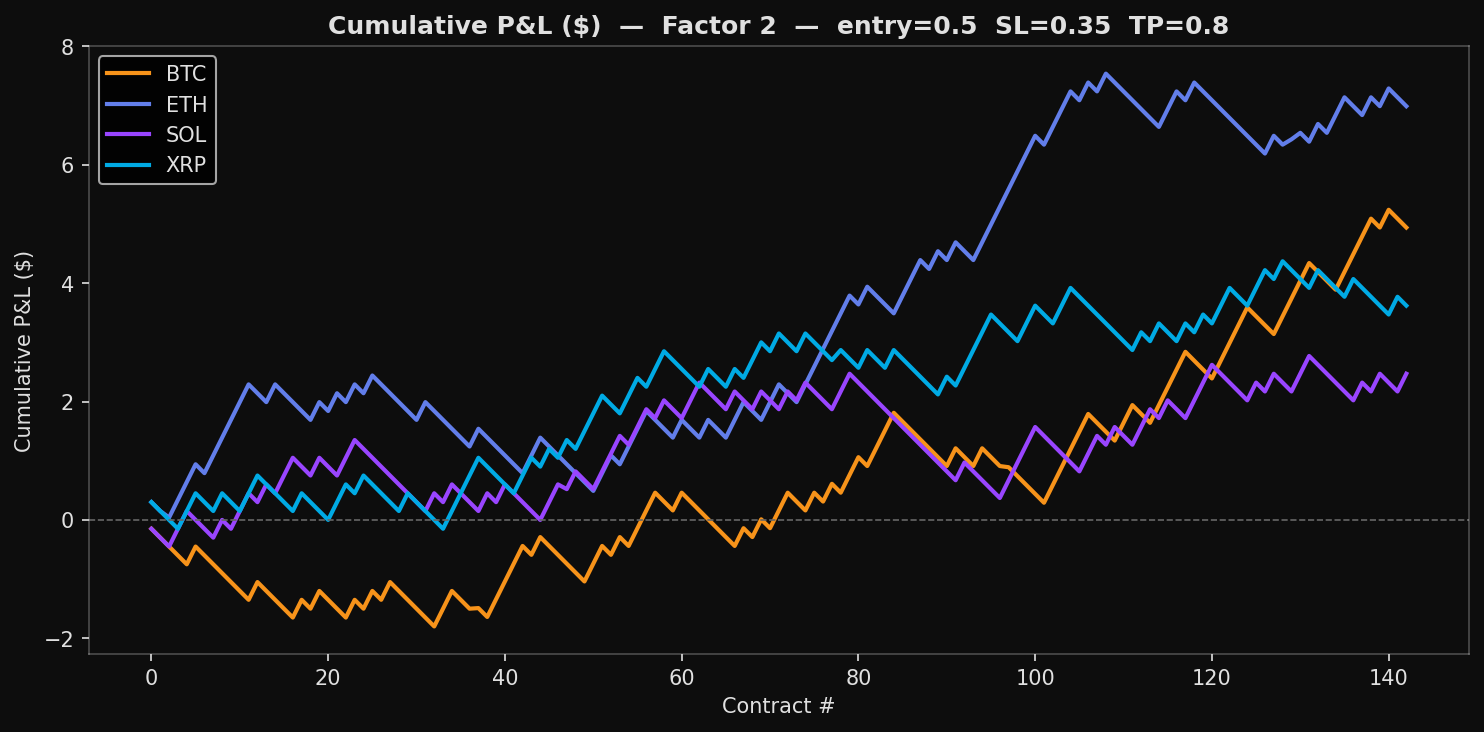
- Factor 2 (TP = $0.80): The stop-loss fires more often than the take-profit across all assets, but the 2:1 payoff asymmetry compensates. All four assets show positive expected value, with ETH leading at +$0.049 per trade.
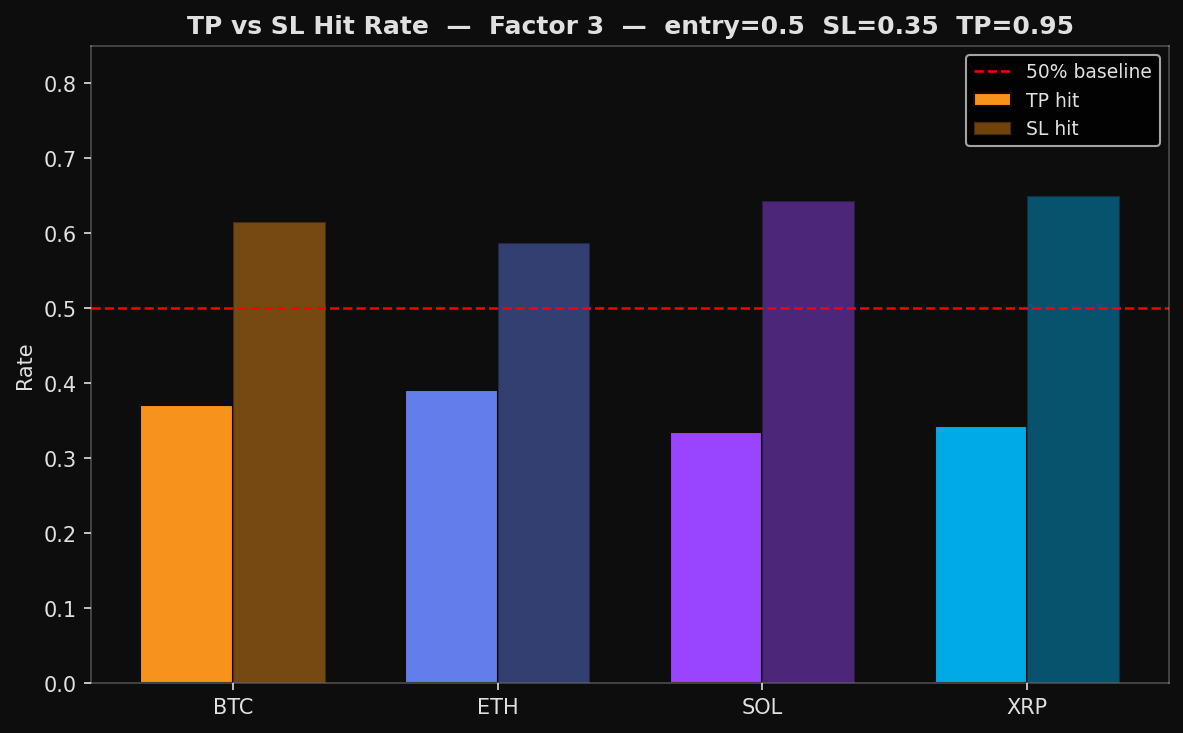
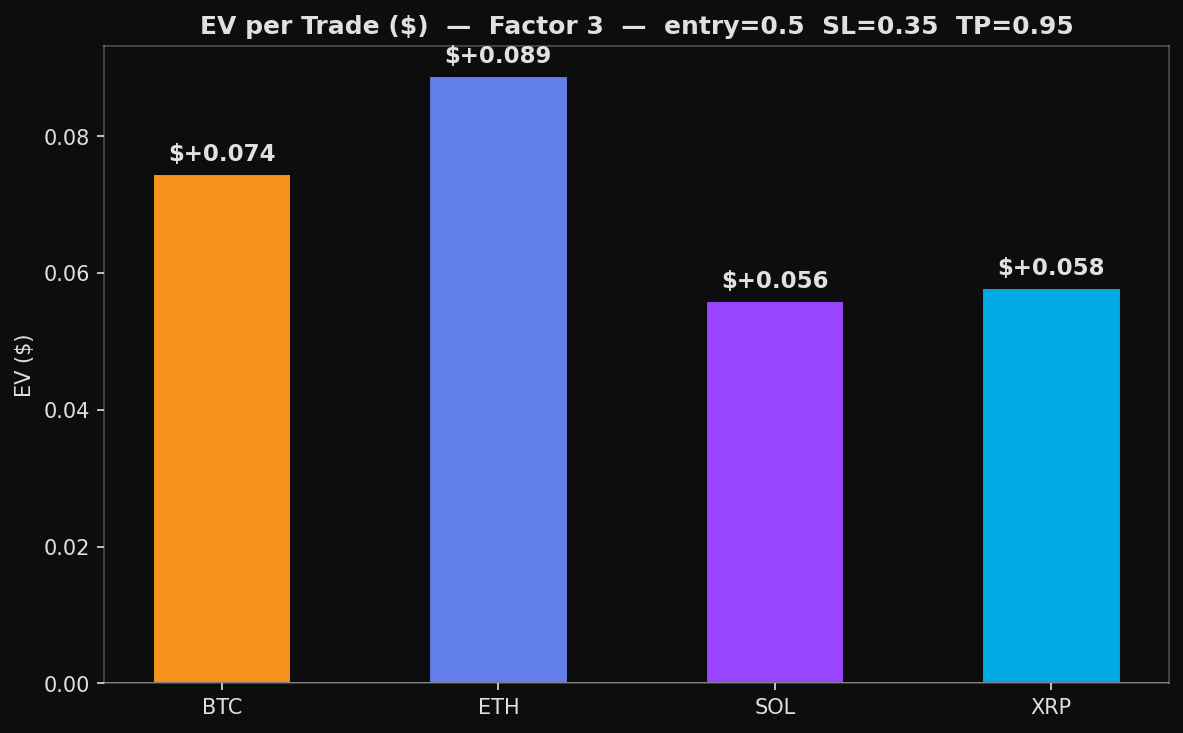
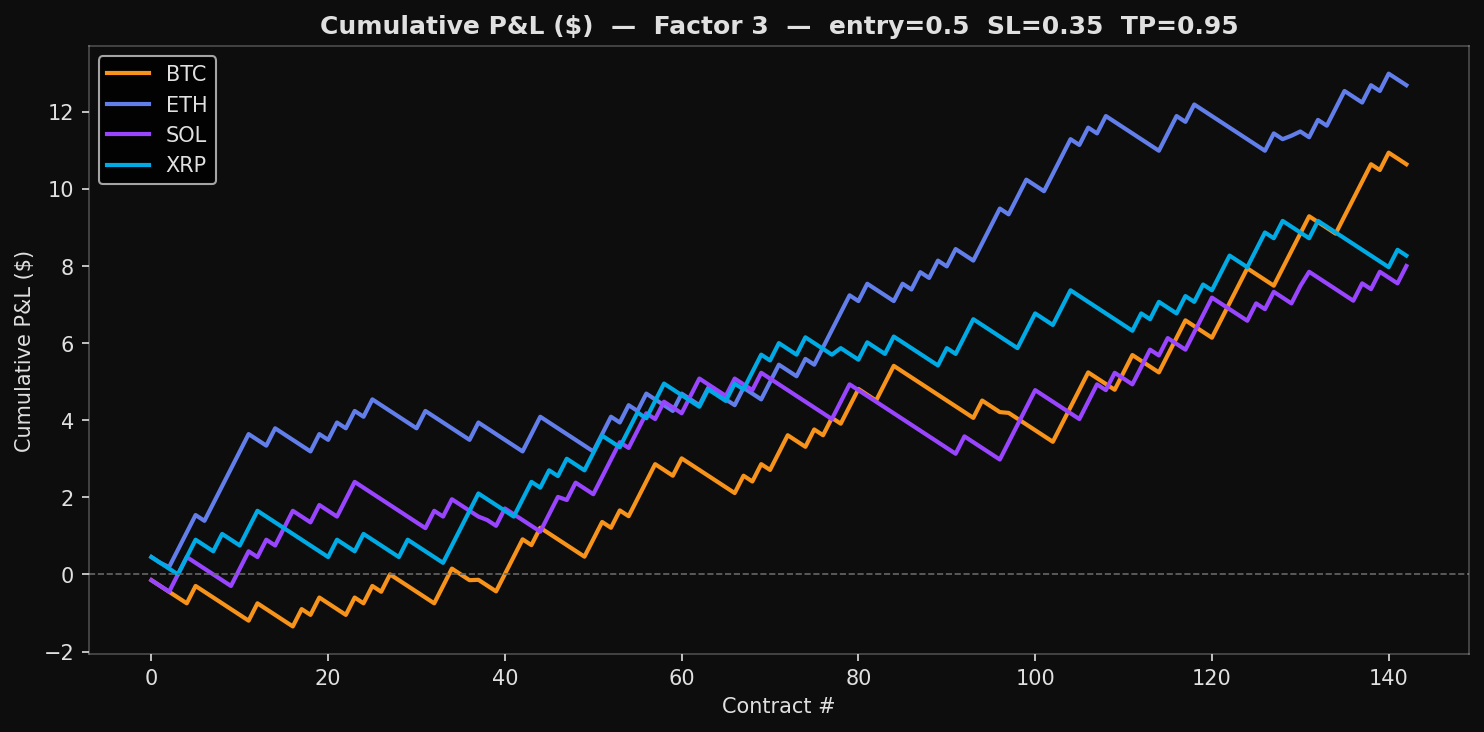
- Factor 3 (TP = $0.95): Higher factor means a wider TP target. The SL fires even more frequently, but each TP hit pays 3x the SL loss. EV increases further, with ETH at +$0.089 per trade.
MONTE CARLO VALIDATION
Ten simulations with different random UP/DOWN assignments across all contracts, using a common bankroll. Each simulation shuffles which side gets picked per contract, confirming that the edge comes from the exit structure rather than side selection. A theoretical Monte Carlo (1,000 simulations of 572 pure coin-flip trades) validates the analytical EV.
KEY TAKEAWAYS
- Positive EV is real: All four assets show positive EV at factors 2–3, consistent across random side assignments.
- Factor 2.5–3.0 is optimal: Beyond factor 3.5, the TP target is too far and rarely triggers, causing EV to collapse.
- The edge is structural: It comes from the asymmetric exit, not from predicting direction. Mirror traders (opposite sides) show similar EV profiles.
- SL on winners is the main cost: A significant fraction of winning contracts dip below $0.35 before recovering, triggering unnecessary stop-losses.
FACTOR 2 ANALYSIS
Entry = $0.50 — SL = $0.35 — TP = $0.80
FACTOR 3 ANALYSIS
Entry = $0.50 — SL = $0.35 — TP = $0.95
HEATMAPS — FACTOR SWEEP
Sweeping TP:SL ratio from 0.5 to 7.0 across all assets